


Daily Stock Market Analysis for Week 26 Wednesday- 100% Uptrend
Confidence building up and market looks like will trade all time highs this week

Market Outlook and Daily Stock Updates
Note:- "Understanding the overall market trend is crucial before analyzing individual stocks. If the market is trending downward, it's unlikely that individual stocks will do well. Thus, assessing the broader market behavior is important before focusing on specific stocks. I rely on a few key indicators to gauge market trends. These indicators guide my decision on whether to invest or hold cash. I assign a percentage score to each of these indicators. The total score determines how much capital I will assign to the market."
Summary of Market Analysis
Corporate Bond (HYG) (20%)
Nasdaq 100 Power Shares (QQQ): (20%)
IBD 50 ETF (FFTY): (20%)
At least 100 New Highs Today out of 8000+ U.S. Socks: 107: (20%)
US New High Stocks Exceed New Low Stocks: 111: (20%)
Corporate Bond (HYG): (20%)
Corporate Bonds confidence is building up seems like it will break to all time highs.

Nasdaq 100 Power Shares (QQQ): (0%)
Nasdaq gets to resistance level and hope it will trade to all time highs tomorrow.

IBD 50 ETF (FFTY): (20%)
The IBD is above 13 EMA, doing good with good volumes.

At least 100 New Highs Today out of 8000+ U.S. Socks: 126: (20%)

US New High Stocks Exceed New Low Stocks: 42: (20%)

Key Stocks - Stocks on Radar.

LAUR - position at 22.50
Day 3 is doing well, tied to break higher but pulled back to the range.

TDUP - STP Exit,
Day 3 - Don't know what is happening to this, stopped out.

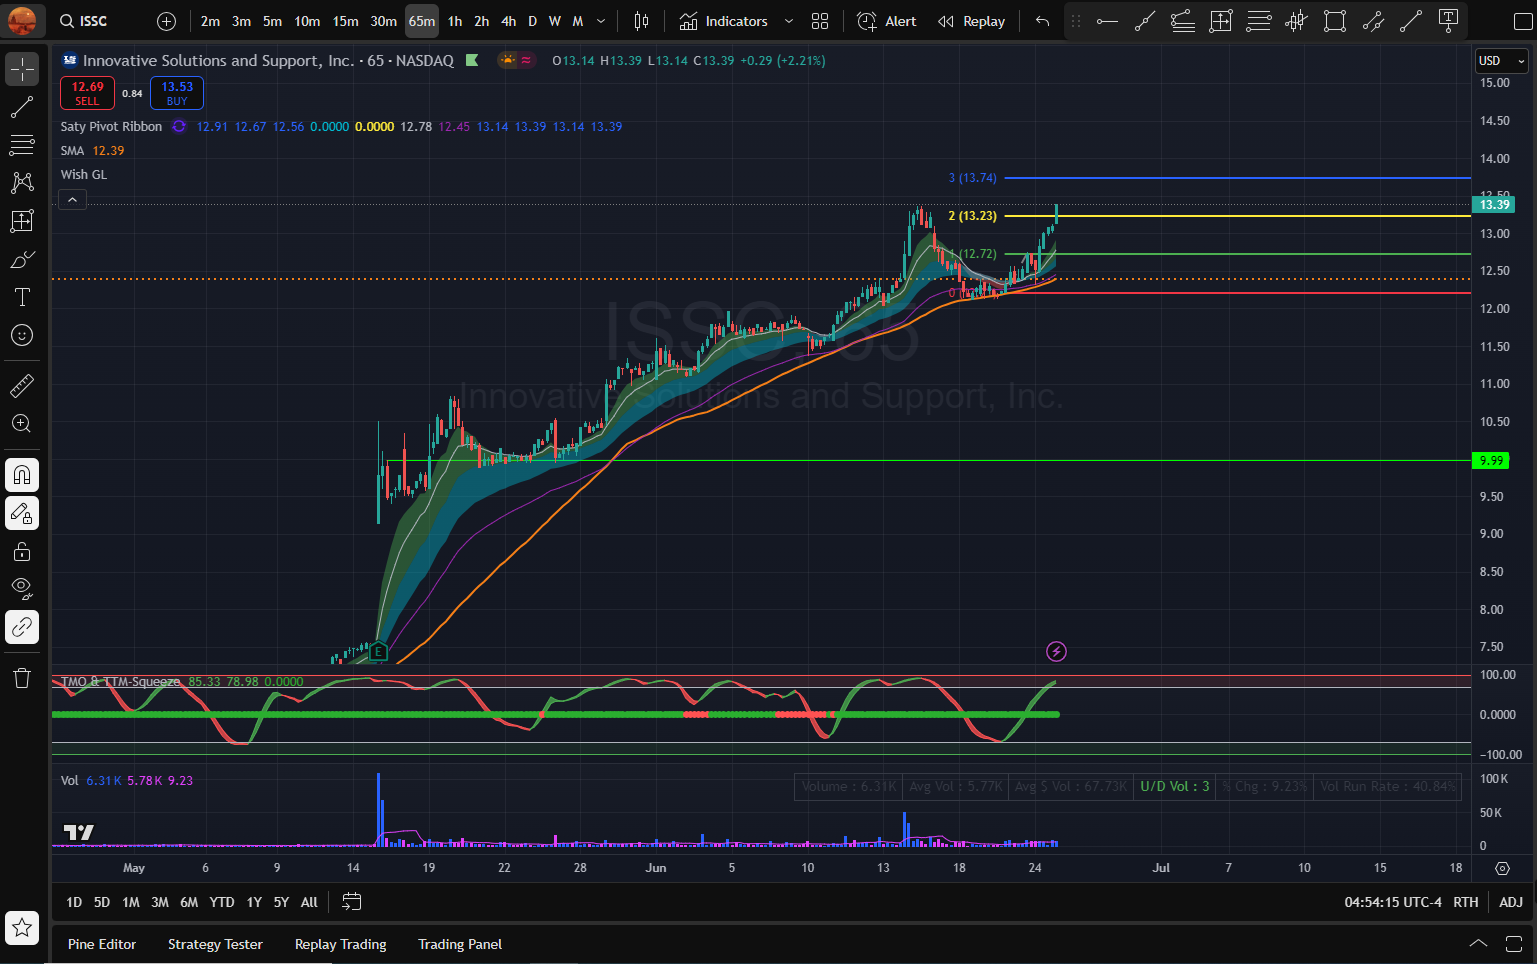
ISSC - Position at 12.70
Good entry and good move, sold half at breakeven.
SGHC - Good setup, with volume showing up. I hope this pops up. Look for a position

NAGE - will look for a position, good setup

Disclaimer:
This newsletter is intended for educational purposes only and should not be construed as financial advice. I strongly encourage you to conduct thorough research and consult a qualified financial advisor before making investments or financial decisions.
Really solid analysis. With major indices showing low realized volatility but rising dispersion beneath the surface, do you see this as a precursor to a structural rotation—or just localized entropy before trend continuation? Curious how you’re reading the current phase geometry.